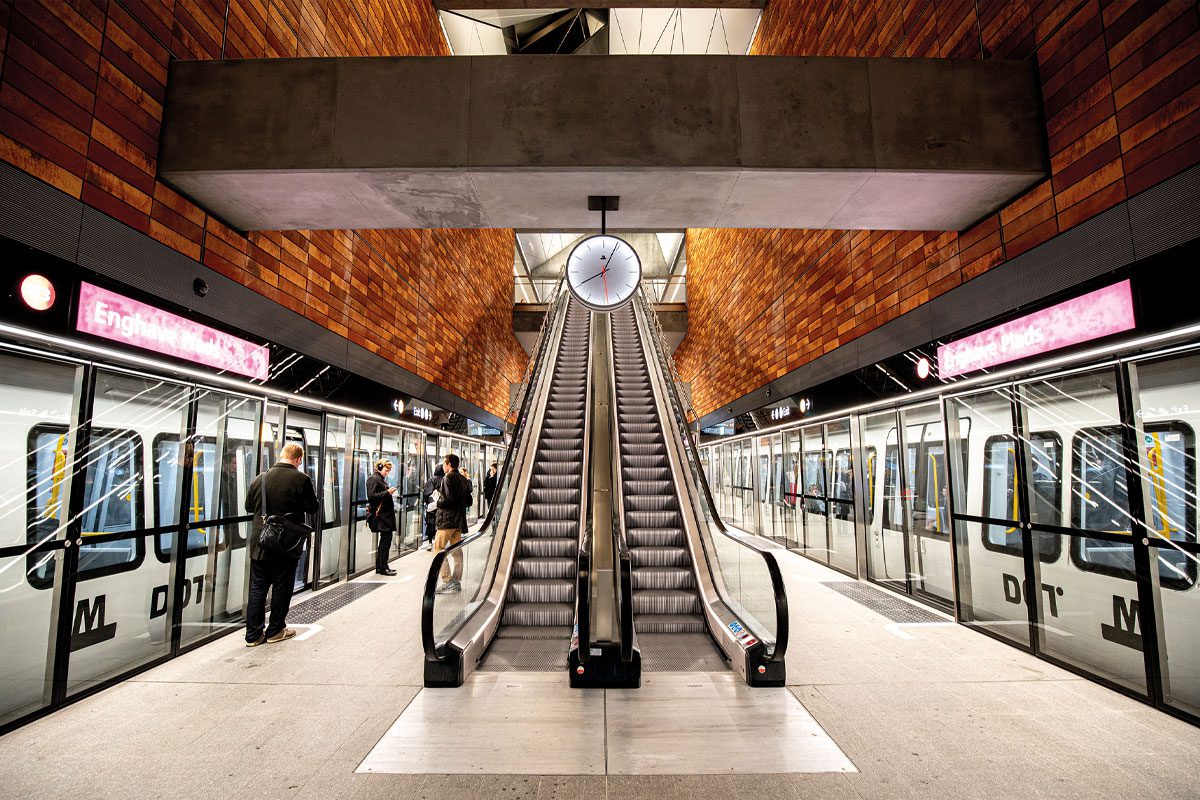
A new study has found high concentrations of small particles in the air in the Copenhagen Metro.
In this study, small, portable sensors were calibrated before and after measurements to ensure reliability. In addition the readings were validated by simultaneous measurements using a TSI DustTrack.
In partially underground lines, stations showed high PM 2.5 levels with an average concentration of 109 µg m−3. The concentrations measured at the stations of the recently opened fully underground M3 closed loop line M3 were 168 µg m−3. The EU has an air quality standard for PM2.5 of 25 µg m−3 (average annual exposure) and is moving towards adapting the World Health Organization threshold of 5 µg m−3.
“While people wouldn’t spend a full year inside the Metro system, it is easy to see that this air pollution can contribute significantly to a person’s annual total,” said Matthew Johnson, coauthor of the study and Professor at the University of Copenhagen.
These are the main conclusions in an article published in Environment International.
Studies of metro systems all over the world have previously shown significant levels of air pollution (PM 2.5) compared to street-level concentrations, with variation depending on the specific design, for example whether ventilation by the piston effect of trains pushing air through the tunnel is supplemented by air pumped through ventilation shafts.
Now a new study – Particulate air pollution in the Copenhagen Metro Parts 1 and 2 – claims to take advantage of a cheaper yet thorough approach to measuring the actual air pollution concentrations underground.
Iron content distinguishes undeground particles
Filter samples of particulate matter were analysed using particle-induced X-ray emission and show an iron content of 88.6 % by mass which is quite different from above-ground particulate matter and consistent with particle production by train wheels, rails and brakes.
Low-cost sensor nodes designed for personal-exposure monitoring were tested against a conventional mid-range device (TSI DustTrak), and gravimetric methods.
The nodes were found to show R2 values of > 0.8 at 1-minute and > 0.9 at 5-minute time-resolution, with an average slope of 1.01 in both cases, which the authors find impressive for this dynamic environment.
The group developed micro-environment (ME) classification techniques which were then tested, and this involved the use of auxiliary sensors, measuring light, carbon dioxide, humidity, temperature and motion.
The output from these sensors was used to distinguish between specific MEs, namely, being aboard trains travelling above- or under- ground, with 83% accuracy, and determining whether sensors were aboard a train or stationary at a platform with 92% accuracy.
This information was used to show a 143% increase in mean PM2.5 concentration for underground sections relative to overground, and 22% increase for train vs. platform measurements.
According to the scientists behind the study, the ME classification method can also be used to improve calibration models, assist in accurate exposure assessment based on detailed time-activity patterns, and facilitate field studies that do not require personnel to record time-activity diaries.


