

Large-scale changes to the environment of the UK, including an apparent loss of habitats and agricultural land, have been revealed in an updated national map of land cover. It was launched by researchers at the University of Leicester together with consultancy firm Specto Natura on 1 July.
The “Coordination of Information on the Environment” (CORINE) Land Cover (CLC) map was completed as part of the Copernicus Programme, a European initiative for Earth observation, which gathers information relating to the environment within the European Union. It depicts areas larger than 25 hectares (0.25 km2) and with a width of 100m.
“For the reference year of 2012, this is the only land cover information available for the UK,” said Professor Heiko Balzter, Director of the Centre for Landscape and Climate Research at the University of Leicester, who led the study. “At the scale of change mapping of 5 hectares or larger, there appears to be a loss of semi-natural habitats and agricultural land. The apparent decline in wetlands is particularly concerning.”
The map arranges UK land cover into three tiers: artificial surfaces; agricultural areas, forest and semi-natural areas; and wetlands and water bodies. Drawn from 2006 and 2012 data, it is based upon a standardised classification system of 44 land-cover and land-use classes.
Balzter added: “The maps show the need for a more detailed study of the state of our countryside, because of the technical limitations of the CORINE mapping approach at a coarse spatial scale.”
What do the maps tell us?
Key findings from the 2006-2012 land cover map are:
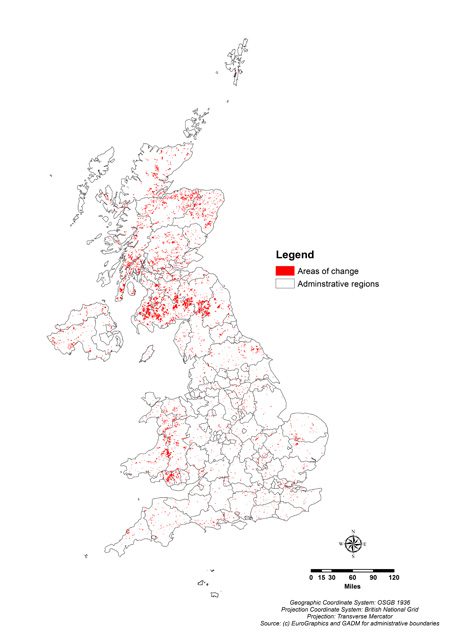
• An area of 225,200 hectares (over 2,250 km2) or 1% of the total area of the UK showed a change in land cover / use from 2006 to 2012. Altogether, 167 different types of change were seen from the satellite images.
• The changes are dominated by forest management, therefore their concentration is higher in Scotland and Wales, following the distribution of managed forest.
• Forestry: The dominant change was clear-cutting of coniferous forest (over 100,000 hectares). Almost 50,000 hectares were regrowing or being replanted with coniferous forest. Clear cutting far exceeded replanting of coniferous forest, however the slow regrowth of forest is more difficult to map consistently.
• Forest loss: Nearly 3,000 hectares of coniferous forests were cleared for industrial development. Conversion of coniferous forest to industrial and mineral extraction sites largely relates to the erection of wind turbines in upland areas, mainly in Scotland. Wind farms fall into the industrial land cover class in the European system. The rate of conversion of land to sport and leisure facilities, mainly golf courses at this scale, continues to decline. Clear cutting of mixed forests accounted for another ca. 3,000 hectares.
• Urban expansion: Changes of a range of other cover types to artificial surfaces indicate urbanisation. Over 7,000 hectares were converted from forest to artificial surfaces, and over 14,000 hectares changed from agricultural areas to artificial surfaces. Over 1,000 hectares were converted from wetlands to artificial surfaces. Completion of construction sites in urban areas made up nearly 3,000 hectares and completed new industrial and commercial developments just over 1,000 hectares.
• Loss of arable land: Over 3,000 hectares of arable land and 2,000 hectares of pastures were converted to mineral extraction sites. Over 2,000 hectares of arable land and 2,000 hectares of pasture land were converted to construction sites, but nearly 2,000 hectares of mineral extraction sites were converted back to pasture land. Pasture land converted to arable land made up over 1,000 hectares. Some agricultural land was planted with forest and some changed to wetlands.
• The most dominant land cover type in the UK in 2012 remains agricultural land, followed by forest and semi-natural vegetation. Artificial surfaces represent 8% of the country with the majority being urban settlements.
How the maps were produced
In addition to the new land cover map, the previous 2006 land cover map has also been corrected by the team and updated to more closely reflect reality. The 2006 revision and 2006-2012 change maps were produced by visual interpretation of optical and near-infrared satellite images provided by the European Space Agency with a spatial resolution of 20m, supplemented with higher spatial resolution images with 5m pixels. The 2012 map was produced in a GIS operation adding the revised database and the change database.
Dr Beth Cole, postdoctoral researcher from the University of Leicester’s Department of Geography, who was in charge of map production, said: “Monitoring like this at a National and European scale is key to allow us to identify these broad landscape scale changes. With a significant improvement on the previous version of the 2006 map, as well as the 2012 update, this study provides data for a large number of users and can be fed into a wide range of research topics and applications.”
What are the maps used for?
Previous uses of the CORINE land cover maps include land management, insurance companies, planning regulations, population disaggregation, forest mapping, green infrastructure, land fragmentation assessment, studies of the urban heat island effect and flood risk mapping. The maps have informed environmental policy in the fields of climate change, nature conservation and biodiversity, natural resources, environmental health and quality of life.
They have also found uses in research of biodiversity, crop yield monitoring, ecosystem services, the water cycle, urban sprawl and wildfire management.
The interpretation of satellite images took two years and was carried out with funding from the European Union, supported by the Department of Environment, Food and Rural Affairs (Defra) and the European Environment Agency (EEA).