

New hi-tech map reveals the most urban, most wooded and most arable counties
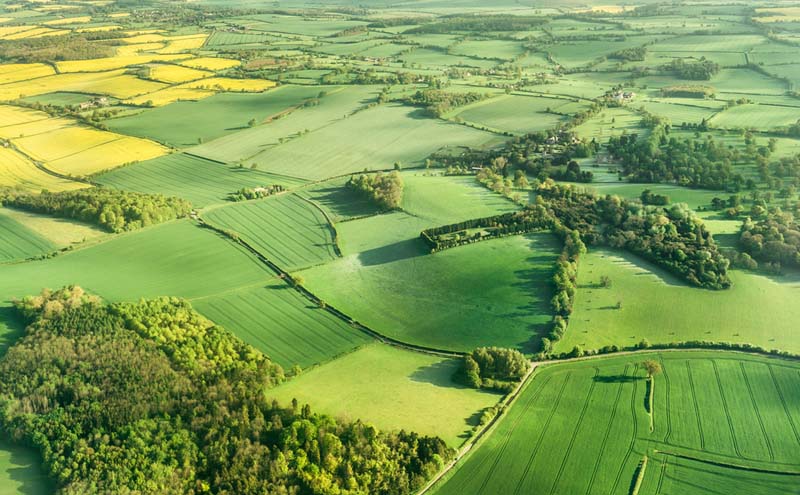
The Centre for Ecology & Hydrology (CEH) has used the latest satellite technology to launch a new digital map which reveals the variability in the character of the UK countryside, from the arable heartlands of East Anglia to the grassy expanses of Wales and Cumbria, and the uplands of Scotland.
CEH’s latest Land Cover Map 2015 – using Landsat-8 (optical) satellite data – is the most rigorous and up-to-date digital land cover map to chart the face of England, Scotland, Wales and Northern Ireland’s rural and urban landscapes.
The Land Cover Map 2015 data has already been accessed by nearly 90 academic institutions via Edinburgh University’s Edina Digimap service. It can also be used by government departments, local authorities, charities and commissions, conservationists, water companies and insurance companies to manage natural resources, facilitate land management and urban planning, carbon accounting and flood risk modelling throughout the UK.
The map shows 21 different classes of land cover, including deciduous and coniferous woodland, heather moorland, grassland, arable land and water, as well as urban areas.
The counties with the greatest urban area and percentage urban are dominated by the UK’s largest cities. For England, Greater London has the largest urban area (1098 km2), whilst the City of London is 91% urban; and is only this low because it’s border is in the middle of the Thames. In Scotland, the City of Glasgow is the most densely urban county at 71%, whilst Lanarkshire has the highest amount of urban at 180km2. For Wales, Dyfed has the most urban (208km2), with South Glamorgan having the highest density at 24% and for Northern Ireland, County Antrim has the most urban (192km2) and County Down has the highest density at 6.6%.
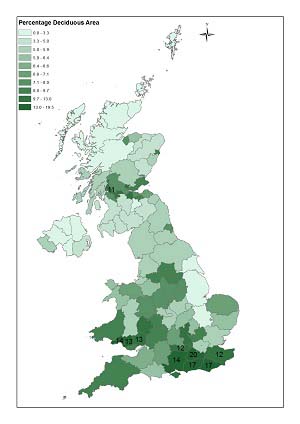
The English county with most deciduous woodland is Devon with 637km2, although Surrey has the highest percentage cover by deciduous woodland at 20%. In Scotland, Argyll and Bute has most deciduous woodland with 357km2, although Dunbartonshire has the highest density at 11%. Dyfed has the largest amount of deciduous woodland in Wales at 479km2, with West Glamorgan having the highest percentage at 14%. For Northern Ireland, County Fermanagh has the highest amount and greatest density of deciduous woodland with 97km2 which is 5.2% of the area.
In England the most arable land cover is located in Lincolnshire, in Scotland it is in Aberdeenshire, in Wales it is in Dyfed and Northern Ireland it can be found in County Down.
Dr Clare Rowland, an Earth Observation Scientist, at the Centre for Ecology & Hydrology, said, “We are very excited about launching the new Land Cover Map for 2015. Previous Land Cover Maps have provided crucial information for a wide range of environmental applications, including enabling water companies to target their monitoring more effectively and allowing ecologists to study the interaction of species with the landscape.
“Hundreds of customers have used previous Land Cover Maps and we expect this map to be even more widely utilised. The map is visually stunning and is a reminder that good quality environmental data can be both incredibly useful and incredibly beautiful.”
You can view the latest Land Cover Map 2015 here: https://www.ceh.ac.uk/services/land-cover-map-2015
In the Top 10’s below two values are given. Firstly, the area of the county covered by the land cover in km2 is given, and secondly, the percentage of the county covered by the land cover type. Two values are given as the wide variation in size of UK counties means the Top 10’s differ. The percentage values capture the density of each land cover type within the county, whilst the area values tend to reflect the size of the county.
Top 10 counties – most urban area in the UK (km2)
Greater London – 1098 km2
West Midlands – 614 km2
Greater Manchester – 585 km2
West Yorkshire – 544 km2
Kent – 516 km2
Essex – 510 km2
Hampshire – 500 km2
Lincolnshire – 426 km2
Lancashire – 397 km2
North Yorkshire – 393 km2
Top 10 counties – highest percentage of urban area (%)
City of London – 91%
City of Glasgow – 71%
Bristol – 71%
Greater London – 69 %
West Midlands – 68 %
City of Dundee – 65%
Tyne & Wear – 49%
Greater Manchester – 46%
Merseyside – 39%
City of Edinburgh – 38%
Top 10 counties – most deciduous woodland in the UK (km2)
Devon – 637 km2
Hampshire – 553 km2
Dyfed – 479 km2
Kent – 470 km2
North Yorkshire – 452 km2
Cumbria – 406 km2
Norfolk – 377 km2
Argyll and Bute – 357 km2
West Sussex – 347 km2
Surrey – 326 km2
Top 10 counties – highest percentage of deciduous woodland (%)
Surrey – 20%
West Sussex – 17%
East Sussex – 17%
Hampshire – 14%
West Glamorgan – 14%
Mid Glamorgan – 13%
Gwent – 13%
Berkshire – 12%
Kent – 12%
Dunbartonshire – 11%
Top 5 counties – most arable land in the UK (km2)
Lincolnshire – 5382 km2
Norfolk – 3429 km2
North Yorkshire – 2837 km2
Cambridgeshire – 2540 km2
Suffolk – 2506 km2
Top 5 counties – highest percentage of arable (%)
Lincolnshire – 75 %
Cambridgeshire – 75 %
East Riding of Yorkshire – 72%
Suffolk – 65 %
Norfolk – 62 %
Top 5 counties – most grassland in the UK (km2)
Cumbria – 4676 km2
Dyfed – 4188 km2
Devon – 3962 km2
Powys – 3938 km2
North Yorkshire – 3256 km2
Top 5 counties – highest percentage of grassland (%)
Powys – 76 %
Armagh – 75 %
Dyfed – 71 %
Gwynedd – 67 %
Tyrone – 67 %
Ordered lists of the extent/percentage of Built-up area, Broadleaved woodland, Coniferous Woodland and Arable are available here: http://www.ceh.ac.uk/land-cover-map-2015-statistics They also include a breakdown of the land cover composition of each UK County.
Land Cover Map 2015 is the fourth national Land Cover Map produced by CEH from satellite data. The first, was produced in 1990, with subsequent maps produced for 2000 and 2007. Processing methods have evolved over time and the land cover classes have varied between the products in response to user requirements.