Identifying and understanding odour problems in a locality can be confusing and contentious. Citizen science seems increasingly equipped to play a decisive role here, for individuals struggling to secure recognition, and appropriate countermeasures, for nuisance pongs in their vicinity. Envirotec looks at a few recent initiatives

One striking new app has been developed by a European project, D-NOSES (Distributed Network for Odour Sensing, Empowerment and Sustainability). Odour Collect provides a crowdsourced map that lets users enter a geolocalised timestamp of bad odours.
It seems to get around the usual complexity of odour identification – a job that normally requires trained experts – by simply asking users to rate the smell on its “hedonic tone” (i.e., is it pleasant or unpleasant?) and intensity. It’s the cunning nature of the validation and back tracing processes operating under the bonnet that seem to underpin the approach, and the website explains that these odour reports “are fed into sophisticated dispersion models that include geographical and weather data to trace the odour path to their probable source.”
Users can view these collected reports on the map, and can zoom in on individual entries. Users can record notes such as “problem already reported to SEPA”.
Pilot studies have been conducted in several European cities. One study in Barcelona engaged local citizens in the Foram area of Barcelona, the location of a number of waste treatment sites in the city. The researchers spent time engaging local citizens, and training them in how to use the Odour Collect app. They also organised “sensory walks” through the Foram area, to enlist people’s participation in identifying the different smells.
So far, the pilot has succeeded in initiating conversation and collaboration (using D-NOSES) with the local authority in Barcelona, according to urban issues publication Next City.
Tracing the source
D-NOSES describes one of its core tenets as “effective odour tracing”, and the website gives examples of where this approach might help resolve situations that have the potential to generate conflict. The website includes he example of a May 2020 news report about an odour problem in Royal Wootton Bassett, where residents blamed a local landfill site, but where the operator of the site in question disputed the claim, citing the recent easterly winds that would have meant the smell must have come from elsewhere.
In this case, the D-NOSES approach might help by collecting data from local residents using Odour Collect, and then using ProOlor, a novel modelling tool, to pinpoint the source of the odour.
Drawing on dispersion modelling techniques, ProOlor is one of an ever richer menu of software tools available to better understand problems such as air pollution. It uses predictive meteorological data rather than real-time data, and is claimed to be able to predict odour emissions episodes 72 hours before they occur (see www.olores.org). It is based on a well-known dispersion modelling system, and runs on Linux.
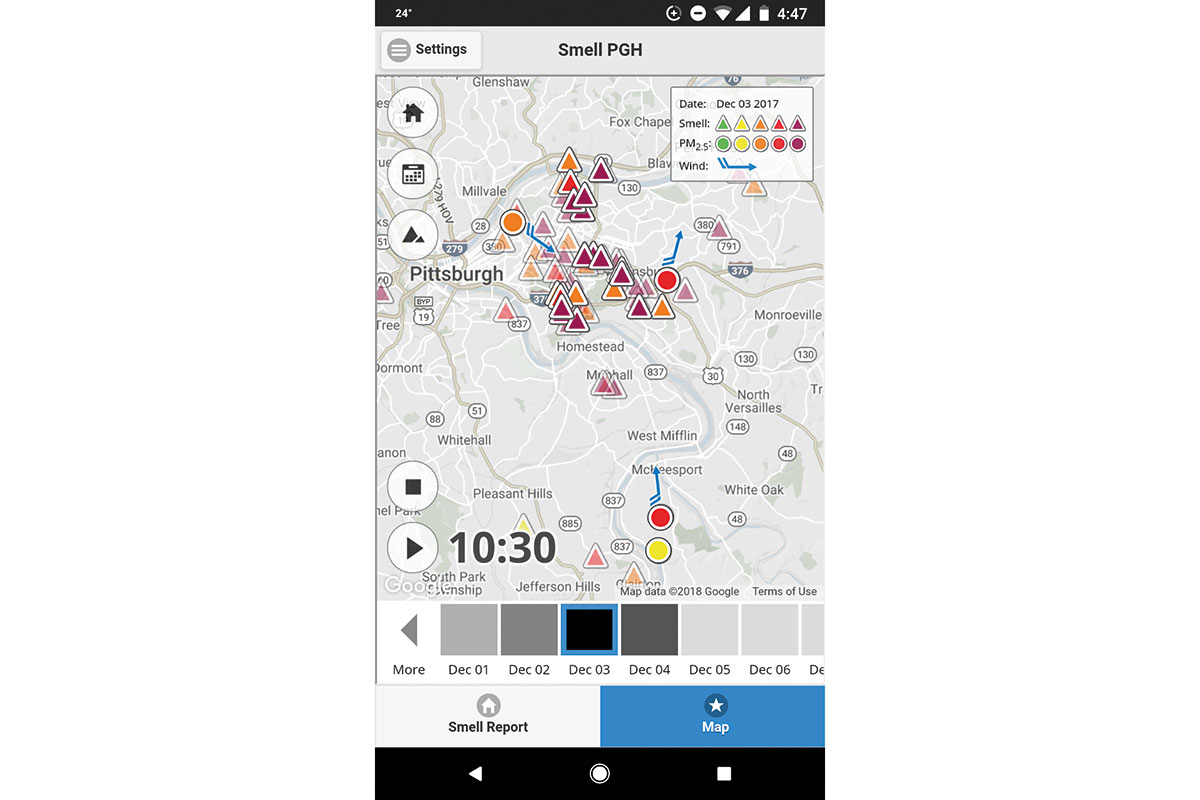
An app with apparent similarities to Odour Collect is Smell Pittsburgh, developed by the Create Lab of Carnegie University. Whenever users come across a smell when outdoors, they launch the app and rate the smell’s intensity. They are also encouraged to add descriptive details (i.e., “industrial”), and symptoms attributable to the experience. Once submitted, the data is pulled together into an email format, incorporating the GPS location, and sent to the Allegheny County Health Department.
The smell reports are also collected on an interactive map visualisation, with a triangle icon denoting each entry, and the colour of which indicates the rated intensity. Tapping a report icon brings up the details (date, time, rating etc). The same map indicates the presence of federal air quality monitoring stations (denoted by a circle), with a colour to indicate fine particulate matter levels, and blue arrows showing wind speed and direction. Users also have the option of pressing a playback button to view animations of things like smell reports, particulate levels and sensor readings over time.


