


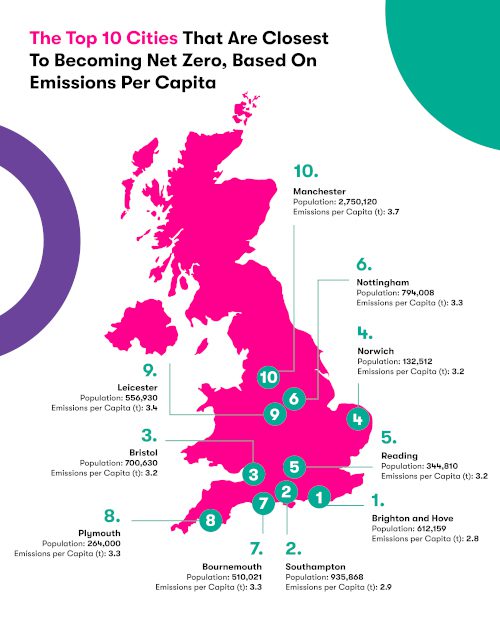
Brighton and Hove appears to be the UK city closest to becoming net zero, according to a recent analysis1 of emissions per capita from alldayPA, a UK call-answering customer services company.
The East Sussex city seemingly committed itself to the agenda set out by the UN’s Paris Agreement in 2015, and set a course for carbon neutrality by 2030 – it began reducing its carbon emissions through a series of initiatives targeting business and domestic outputs. Currently, the city’s CO2 levels are below 3.0t (2.8t), which is in line with the UN’s net zero sitemap.
The comparison data is based on carbon emissions per capita, and Brighton and Hove is closely followed by Southampton (2.9t), and then Bristol (3.2t), Norwich (3.2t) and Reading (3.2t), in joint third place.
Next up is Nottingham (3.3t), Bournemouth (3.3t) and Plymouth (3.3t). The remaining areas that produce less than 4.0t emissions per capita, are Leicester (3.4t), Manchester (3.7t), Northampton (3.7t) and Glasgow (3.8t).
When it comes to air quality, however, the top spots are occupied by Nottingham, Aberdeen, Glasgow, Manchester and Edinburgh.
Brighton and Hove has the 8th best air quality rating, at 2,551. Nottingham, which is top of the list, has a rating of 2,342.
Air quality seemed to improve during 2020 with 46.6% of the UK’s workforce working from home. Fewer people were using cars, taxis and public transport to get to work. Figures released by the ONS now show that during October 2021, with hybrid working in place, 30% of the UK’s population were working from home.
Customer service company alldayPA also looked at the percentage of waste recycled in each area between 2019-2020. According to the firm’s stats, Brighton and Hove is 8th on the list, with 42.1% of waste recycled during this time.
Notes
[1] To help calculate which cities are the closest to becoming Net Zero, alldayPA has used data sources from the government’s national statistics, Compare the Market and local councils to assess which locations in the UK are doing the most to help combat global warming.
Links:
https://data.gov.uk/dataset/723c243d-2f1a-4d27-8b61-cdb93e5b10ff/uk-local-authority-and-regional-carbon-dioxide-emissions-national-statistics-2005-to-2019
https://assets.publishing.service.gov.uk/government/uploads/system/uploads/attachment_data/file/966043/LA_and_Regional_Spreadsheet_1920_rev.xlsx
https://www.comparethemarket.com/energy/content/greenest-cities/