
A developer of air quality monitoring technology has voiced concern that air quality data can be displayed in a number of different formats, which could be misleading.
The measurement values from air quality sensors are usually of greatest value to members of the public when they are displayed in a simple, easy to understand format. To achieve this, governments and organisations utilise an air quality index (AQI) to communicate levels of air pollution. AQI information is obtained by averaging readings from air quality sensors and categorising them in a traffic light system to help viewers understand the current or forecast air quality. This categorisation is generally based on commonly accepted norms and the latest research on the effects of air quality on health.
“An AQI is an excellent tool for imparting information without having to educate readers on specific pollution concentration values,” said Wiktor Warchalowski, CEO of Airly. “The problem, however, is that several different AQIs exist around the world, and they all vary in the pollution levels that they regard as high, medium or low. Consequently, at Airly, we find that we can pass our sensor data through two different AQIs and create two completely different displays – from the same data, in the same place, and at the same time!”
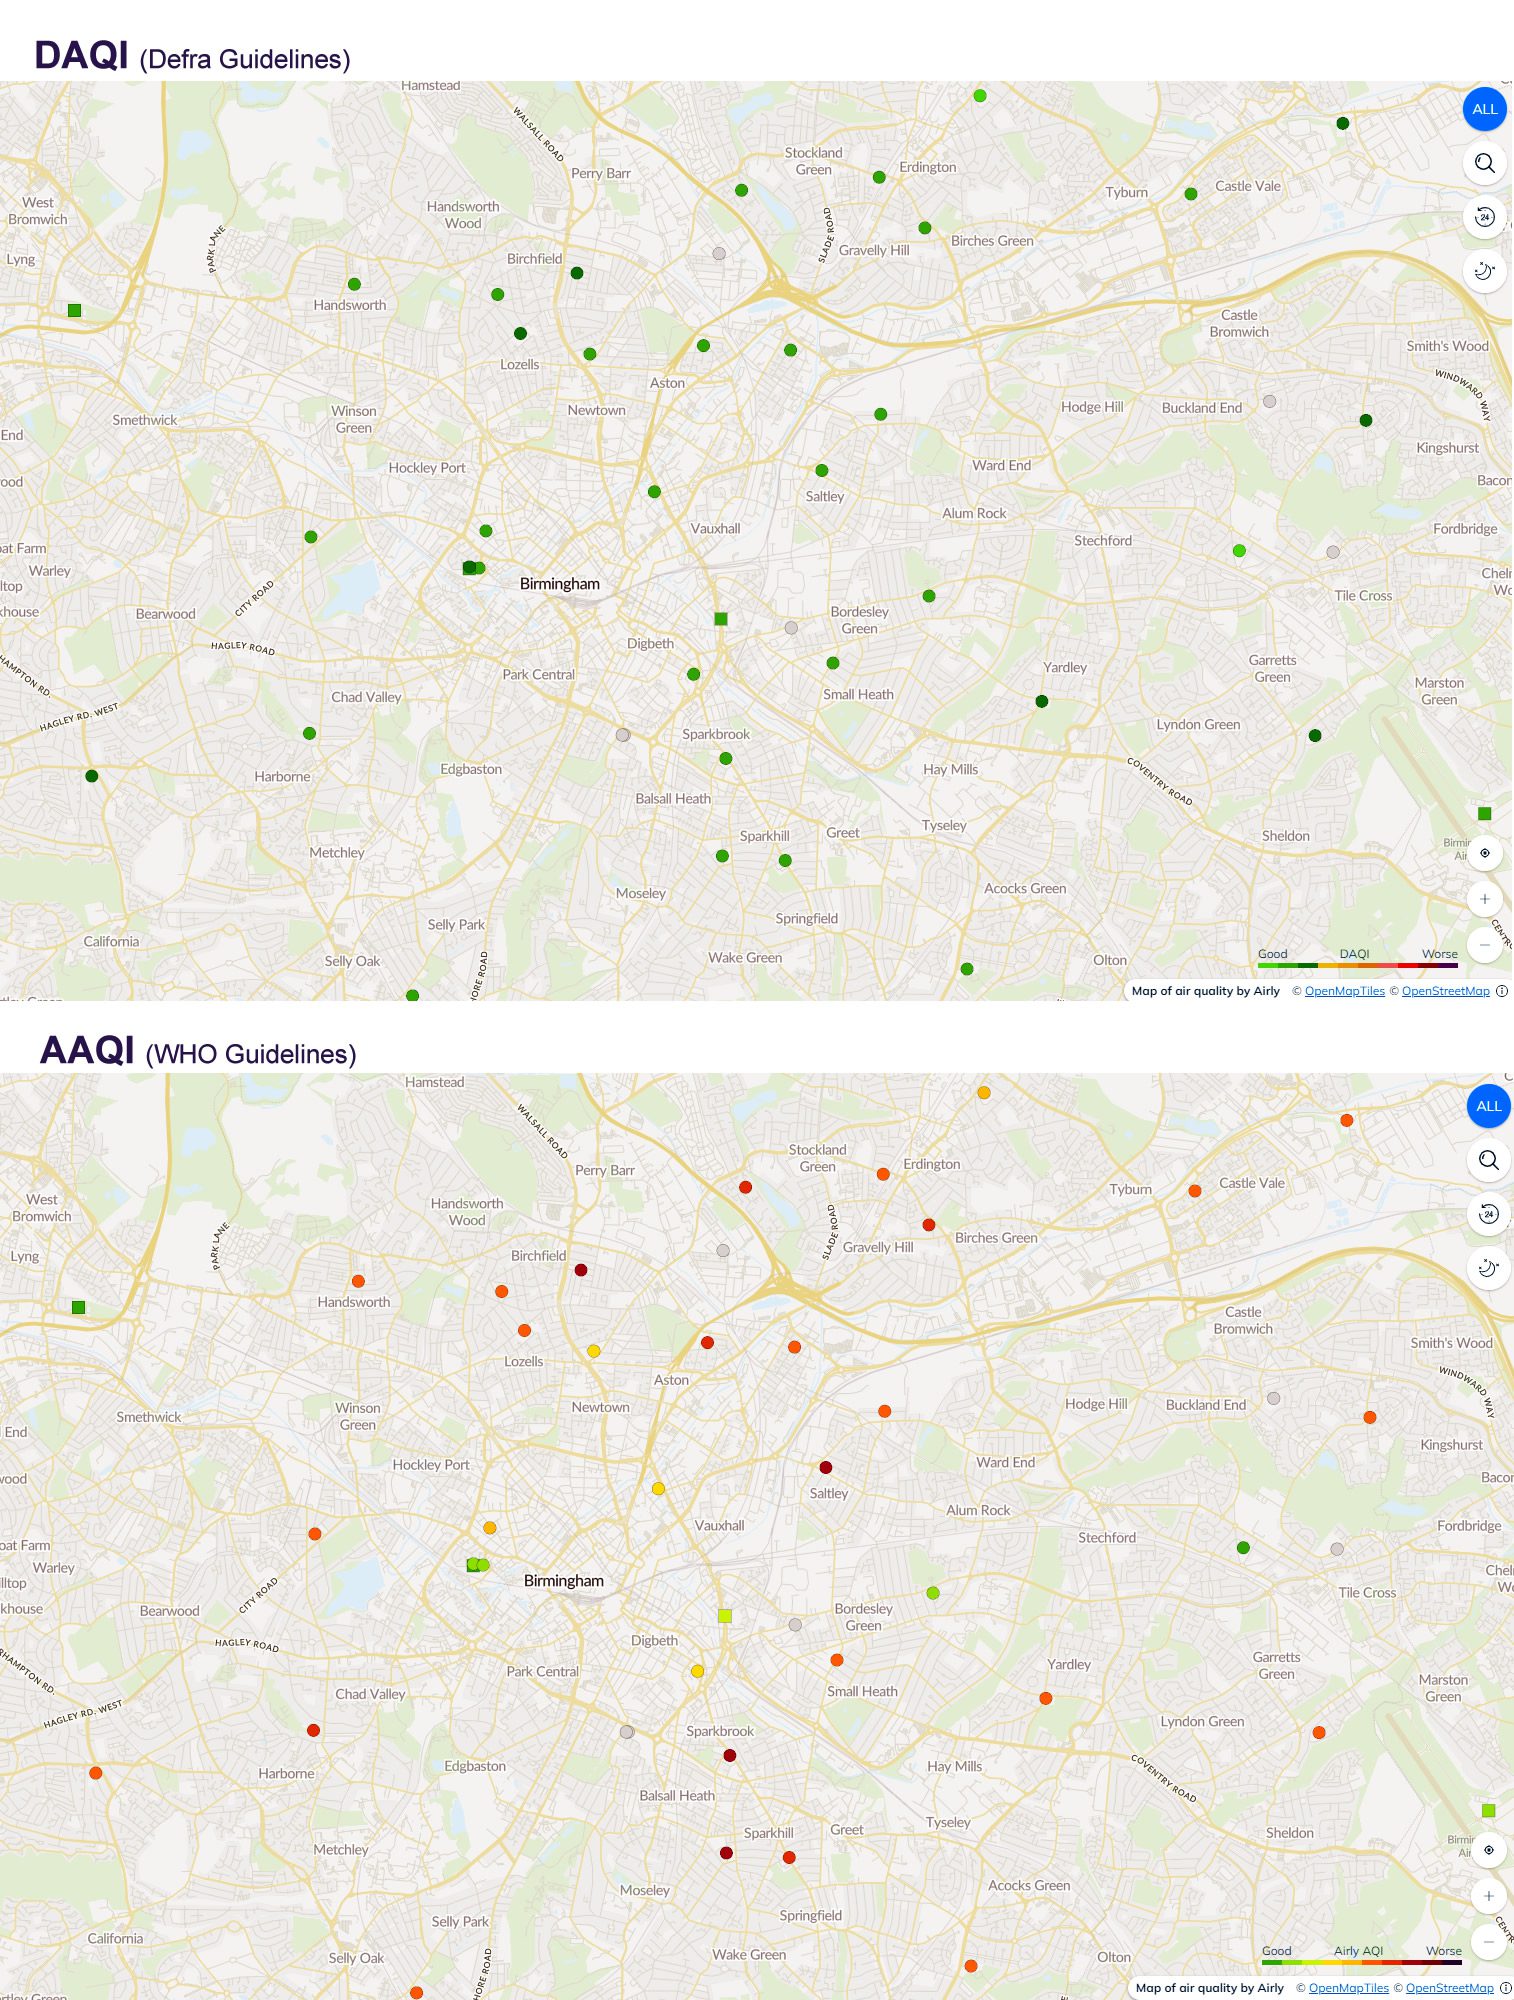
In the UK, Defra has created the Daily Air Quality Index (DAQI) to display levels of air pollution and provide recommended actions and health advice. The index is numbered 1-10 and divided into four bands. Low pollution levels (1-3) are coloured green, Moderate pollution (4-6) is orange, High (7-9) is red and Very High (10) is purple.
Within DAQI, for example, level 3 (Low pollution – green) for fine particulates (PM2.5) is defined as 24-35 µg/m3 (24-hour average). In contrast, within the European AQI, 25-50 µg/m3 for PM2.5 is defined as Poor air quality and shown as red. The World Health Organization (WHO) has produced even tighter targets for PM2.5. In September 2021, it published a new lower guideline value of 5 µg/m3 for annual average concentrations of PM2.5, and a 24-hour average guideline value of 15 µg/m3.
Airly recently developed a new AQI, based on WHO Guidelines. This Airly AQI (AAQI) displays levels of air pollution in comparison with WHO guideline values. So, for example, the AAQI value for 15 µg/m3 PM2.5 is represented by 100, and a display of 500 would mean that PM2.5 levels are 5 times the guideline value.
Where more than one air quality parameter is measured, AAQI displays the most harmful value (the parameter furthest above the guideline value) so that viewers can see how bad the air is. The display provides 6 levels of pollution, which are split to provide 10 different colour levels (see chart).
Wiktor Warchalowski said: “The main objective of AQIs is to provide simple to understand information on air quality, so that citizens can easily perceive three issues: (1) that one area on a map is more polluted than another, and (2) that air pollution today is better or worse than it has been in the past.
“These two pieces of information enable citizens to make informed lifestyle decisions, and all of the main AQIs meet that goal. However, goal (3) is to allow citizens, and especially those that are vulnerable, to determine whether current or forecast air quality is good or bad, and as has been demonstrated, this is where different AQIs can display apparently conflicting information.
“There are two solutions to this problem. Firstly, governments could agree on one universally accepted AQI; but air quality objectives and timelines vary internationally so this seems unlikely. The second solution is therefore mostly likely, and this is for vulnerable citizens to learn the absolute values for specific pollutants that represent a threat. It therefore falls on those of us that develop these systems to develop AQIs that deliver all three goals in a clear, and easily understandable way.