
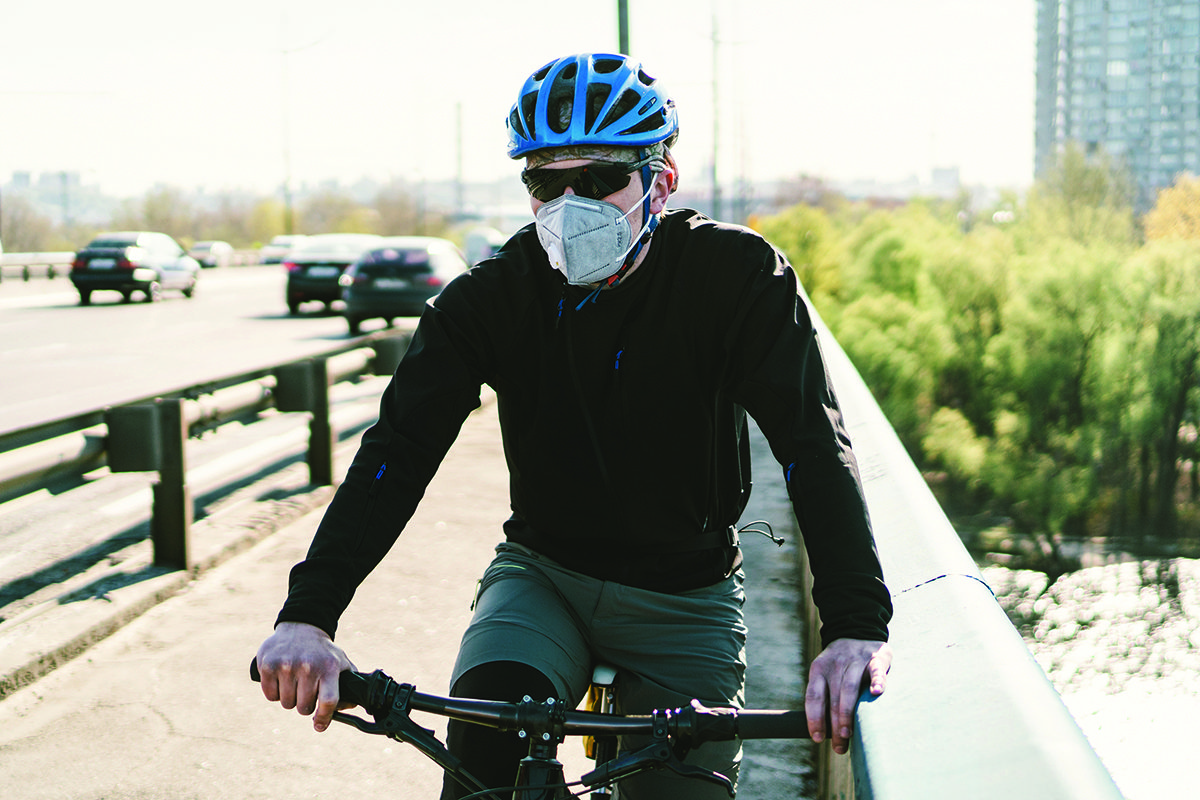
Now considered the world’s leading environmental risk factor, the striking fact about PM2.5 is how little of the world’s populace manages to escape seemingly dangerous exposure. A couple of recent studies attempt to document the changing profile of this pollutant, and its prevalence in different regions of the world.
One eye-catching finding unveiled in March by a Monash University study puts the number free from dangerous exposure at only 0.001% of the global population.1
Only seven countries and three territories last year met World Health Organization pollution guidelines for fine particulate matter, according to the latest report by Swiss company IQ Air, published in March.2
WHO guidelines currently state that annual average concentrations of PM2.5 should not exceed 5 µg/m3, while 24-hour average exposures should not exceed 15 µg/m3 more than 3 – 4 days per year.
In the US – pegged by IQ Air’s report as falling short of meeting WHO guidelines – perception of the danger appears to be heightening, and in February the EPA lowered the acceptable annual amount of PM 2.5 from 12 to 9 µg/m3, seemingly to reflect new findings.
The EPA presents a sliding scale of lethality for PM2.5 exposure, for which the upper limit is 500 µg/m3 – which adds perspective to New Delhi’s lung-rupturing 900 µg/m3 levels recorded in late 2019.
Some research indicates that even a modest increase of 10 µg/m3 of PM 2.5 in the surrounding air is associated with a 10 percent increase in a person’s likelihood of dying from heart disease.
Reacting to IQAir’s latest report, Greenpeace International senior air quality scientist Aidan Farrow said that “In 2023 air pollution remained a global health catastrophe.”
The report is said to be based upon a worldwide monitoring network of more than 30,000 stations.
Overall, the trend in European cities is towards lower PM2.5 levels in 2023. PM2.5 levels fell for 36 countries, increased for six, and remained constant for one.
The report also said 7% of cities in Europe met the WHO PM2.5 guideline, with the UK having the highest number, followed by Finland and Sweden. And more European cities fell within the green range (1 to 2 times the WHO annual PM2.5 guideline) in 2023 compared to 2022.
Iceland, Estonia, and Finland are the only countries meeting the WHO annual PM2.5 guideline in IQ AIr’s analysis. Iceland remains the least polluted country with an average concentration of 4 µg/m3, although it experienced a slight increase in PM2.5 levels in 2023.
Bosnia Herzegovina saw an 18% decrease in PM2.5 levels but remains the most polluted country in Europe, with an annual average concentration of 27.5 µg/m3.
Croatia made significant progress, lowering PM2.5 levels by more than 40%.
Montenegro experienced the greatest absolute increase in PM2.5 concentrations.
One obvious conclusion is that much more work remains to be done to combat air pollution. And data gathering is key to this effort.
IQ Air said government-operated stations contribute 73% of air quality data in Europe, with Germany having the highest number of cities included in the report and Russia’s data bolstered by non-government operated stations. With this latest report, the quantity of data has grown, said IQ Air.
Machine learning is helping to access and interpret the available data, according to some researchers, and it underpins one recent effort to estimate daily exposure levels of PM2.5, in different parts of the world.
From Monash University, in Melbourne, and published in March in The Lancet Planetary Health, this study looks at PM2.5 levels in the two decades up until 2019.
Daily levels of PM2.5 have reduced in Europe and North America in this period, while levels have increased in Southern Asia, Australia, New Zealand, Latin America and the Caribbean.
Professor Yuming Guo said: “In this study, we used an innovative machine learning approach to integrate multiple meteorological and geological information to estimate the global surface-level daily PM2.5 concentrations at a high spatial resolution of approximately 10km ×10km for global grid cells in 2000-2019, focusing on areas above 15 µg/m³ which is considered the safe limit by WHO (The threshold is still arguable),” he said.
The study noted that, In southern and eastern Asia, more than 90% of days had daily PM2.5 concentrations higher than 15 µg/m³. The highest PM2.5 concentrations were distributed in the regions of Eastern Asia (50.0 µg/m3) and Southern Asia (37.2 µg/m3), followed by northern Africa (30.1 µg/m3).
The study also noted that Australia and New Zealand (8.5 µg/m³), other regions in Oceania (12.6 µg/m³), and southern America (15.6 µg/m³) had the lowest annual PM2.5 concentrations.
Notes
[1] “Global estimates of daily ambient fine particulate matter concentrations and unequal spatiotemporal distribution of population exposure: a machine learning modelling study”, The Lancet Planetary Health. https://www.thelancet.com/journals/lanplh/article/PIIS2542-5196(23)00008-6/fulltext. [2] “2023 World Air Quality Report”, IQ Air. https://www.iqair.com/dl/2023_World_Air_Quality_Report.pdf [3] ibid [4] ibid [5] ibid
[ side panel ]
What is it?
Particulate matter (PM) refers to tiny particles of liquid or solid matter made of materials such as dust, dirt or soot (i.e., impure carbon resulting from the incomplete combusion of hydrocarbons).
The two size categories on the radar of epidemiologists are 2.5 µm and 10 µm diameter particles: PM2.5 and PM10, respectively. These are indiscernible by the naked eye, and so don’t specifcally account for the dusty haze seen hanging over cities.
While PM10, the larger particle size, is to some extent filtered or captured by hairs and mucus in the respiratory tract, PM2.5 has a far greater capacity to enter the body and bloodstream, hence its greater danger.
Common sources of both categories of particulate matter include abrasive machinery and activities like sanding, drilling and demolition. Combustion is also a big contributor, whether from vehicle engines, coal- or gas-fired power stations or wood-burning stoves.