

More data is becoming available to help with understanding why so much sewage is being spilled in UK rivers, and fascinating efforts are underway to interpret it and present it to the public in an accessible and transparent format. Envirotec reviews the latest data, tools and what experts believe we can learn.
The EA released the latest batch of Event Duration Monitorling (EDM) data on 31 March, offering a picture of untreated sewage discharges from monitored storm overflows and CSOs during 2021. It showed that raw sewage spilled from these points 372,533 times in 2021, for a total of 2.66 million hours, a slight decrease on 2020, a decline attributed to the drier weather during that year.
Water firms are only supposed to discharge from these points during periods of exceptional rainfall, but a seemingly far more profligate deployment has become apparent in recent years, and this has been a rallying point for protest by groups like local campaigners, citizen scientists, and environmental NGOs.
It’s a crisis in no uncertain terms, with only 14% of rivers in England considered ecologically healthy, according to a January report from the Environmental Audit Committee (EAC). But better data is key to tackling it, and now it seems anyone can access a relatively clear picture of who’s spilling where, when, why, and for how long,
Sensor coverage
Or at least, wherever there are EDMs at storm overflows and CSOs – prior to 2018 these were only installed where these points were located in sensitive or high-amenity areas. The EA has since mandated water utilities to provide complete coverage of the network, which at this point leaves only 11% of them unmonitored, with the last portion scheduled to come online by 2023.
Annual publication of this data is a requirement of the Environment Act – which passed into law in November 2021. The Act also requires the Government to develop a Storm Overflows Discharge Reduction Plan, to be presented to parliament in September 2022, setting out how they’re going to stop sewage pollution. Under the stewardship of Defra’s Storm Overflows Task Force, the plan is currently receiving input from a six-week public consultation running until 12 May (although you could be excused for having missed it).
At a Zoom conference in April The Rivers Trust’s Christine Colvin lamented “the low level of ambition in the Consultation plan”, pointing to its stated aim to improve 52% of storm overflows so that they’re not spilling more than 10 times a year. The 31 March data from the EA shows that 40% of them are already recording 10 or less spills per year.
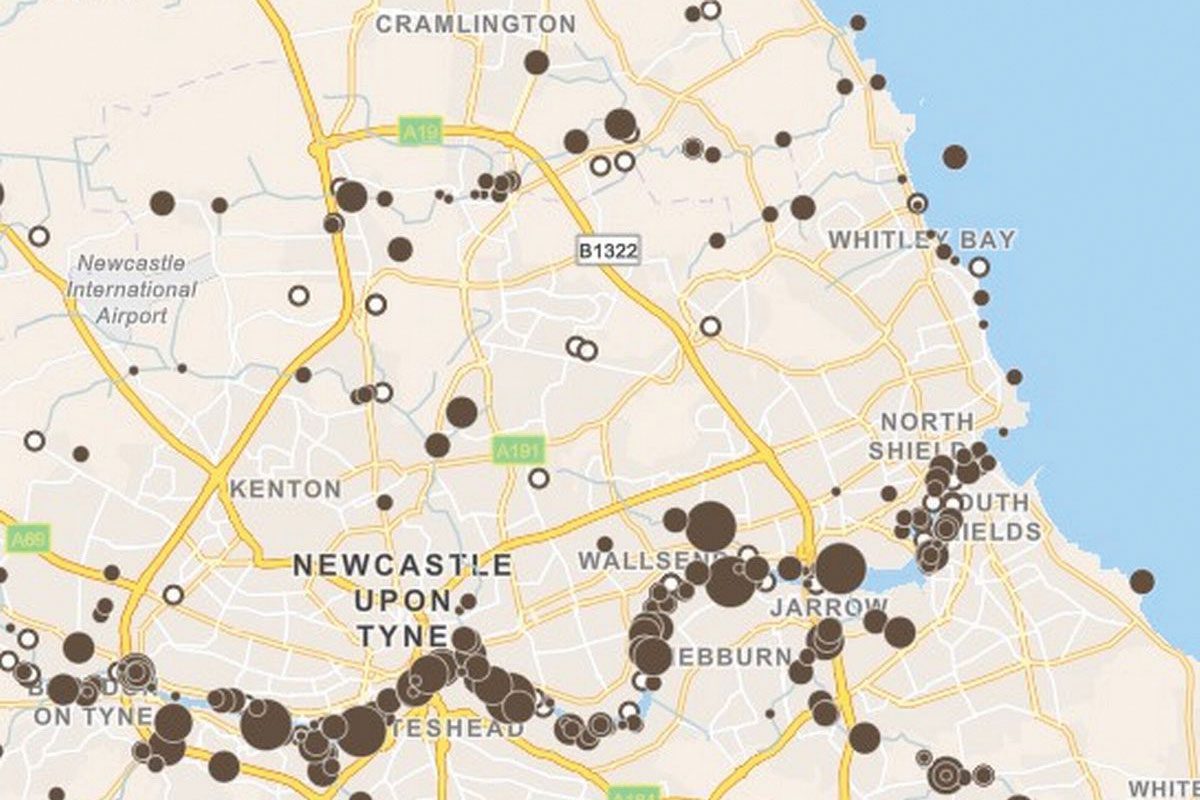
The EDM dataset now makes it possible to drill down into the details of untreated sewage spills in England and Wales, including their location, frequency and duration. All of this data can be accessed online via The Rivers Trust’s “Sewage Map” (pictured), seemingly the only free-to-access resource that lets the public see where sewage leaks are happening on an interactive map.
Map reference
First published in 2019, the map is widely cited as a driving force behind recent public pressure on the government and water companies, which has led to the Environment Act – seemingly milestone legislation, although many campaigners have reservations. And the map has also supported campaigning efforts such as those recently culminating in Port Meadow in Oxfordshire acquiring bathing water status. The designation entitles the area to a stricter bacterial testing regimen, and places a duty on Thames Water, landowners and the local council to improve the water quality within five years, to make it suitable for swimming.
The Rivers Trust has recently updated the map to allow more directed search enquiries, for example, allowing you to search by water company, local authority district, constituency, CaBA catchment, WFD waterbody catchment, or the number of counted spills. It provides a great deal of context for making sense of the EA data at a local level.
It’s also now possible to download the data as a report or CSV file, so it can be used by other software. “Until now, the problem has been hidden away,” as the River Trust’s Michelle Walker explains, adding that the group is “passionate about open data, and getting information out there.”
Up to date?
At present the data on the site covers the past three years, including that for 2021. In terms of the collection schedule that has run to date, the EDM data is reported by the water companies to the EA in around February, which then collates it, cleans it up and publishes it in late March.
Users of the map can enter a postcode or zoom-in to a particular locality, navigable via a symbol system that includes dark circles for storm overflows with EDM data (the size of the circle denoting the number of spills, up to a maximum of 100+ spills). White circles show storm overflows where there is no EDM data, so we don’t yet know what they’re spilling.
There are also beige squares showing treated sewage overflows. The latter might be a WWTW that meets a defined standard of treatment, or a septic tank or small packaged treatment plant. There are seemingly a lot of septic tanks in the country that are not included in the “consented discharges register”, which is where the map has pulled this information from.
Of course, WWTWs don’t sterilise their treated sewage unless they are downstream from a recognised bathing site – a fact worth bearing in mind, said Walker.
There are still one or two things the map doesn’t incorporate yet, such as emergency overflows, and things like pumping stations.
New data: Why a spill occurred
It does let you see, for example, which companies are responsible for particular spills, and a pop-up tab appears when you hover over a site of frequent spillage, providing further details like the receiving water body, and the reason for the spill. The reason is often recorded as “hydraulic capacity”, which means the sewer network can’t cope with the volume, both of sewage and storm water. And it’s easy to see how campaigners or concerned locals might find this useful evidence to cite, for example, if looking to object to a housing application going into a local authority.
Addressing the problem
An under-investment in the underlying infrastructure is widely accepted as the reason for much of the storm overflow spilling that goes on. An 11 April blog by another campaign group, WASP, noted a certain propensity for politicians to cite out-dated, Victorian infrastructure as the root of the problem and a simple inevitability rather than a failure of the water industry to invest adequately and keep pace with demand, noting that since privatisation “the water industry was allowed to extract £72 billion in profits from bill payers.”
Even recent press releases from the government acknowledge this provenance, as the blog noted.
With attempts to tackle the problem, there are always conservation fears that “the cure might be worse”. One attendee said his local utility, Wessex Water, were proposing to install a large overflow tank to reduce the number of overflows, something that could result in substantial disturbance to the land and local ecology, adding a large slab of concrete to an area of natural interest.
As Colvin said, The Rivers Trust has been “advocating for nature-based solutions to be implemented as far as possible” and noted the possibilities of things like SuDS and sustainable drainage. This was something they had wanted to see more explicitly defined in the government’s Storm Overflow Discharge Reduction Plan. They give some vague guidance about it, she said, but no specific targets or directives.
Walker said the Trust was working on a national-level citizen science initiative that was trying to find ways to provide the kind of evidence that is more acceptable to groups like water firms, green finance partners and the EA, “so that we can provide the level of evidence needed to show the impact of these nature-based solutions.” But “everything’s going to have to be done differently.” She noted that water firms are geared up to work with “end-of-pipe, concrete solutions with high levels of certainty and engineering” whereas nature-based solutions require taking decisions that involve more risk and uncertainty.
How good is the data? Do the monitors all work equally well, and are they well maintained? Walker said they were still trying to understand the different types of equipment, and grasping this level of nuance was “a work in progress”. Water companies have been helpful in proactively providing the data, she said, and there is a statistic in the database that tells you how much of the year each EDM was operational – so where the water company knows there was a problem and has reported it, this has been captured in the system.
Getting more data
More data from more disparate sources might be one avenue of progress. For example, to build-in elements from citizen science, and schemes like Outfall Safari, where people go out and spot visible signs of sewage pollution.
Agricultural run-off is a larger contributor to pollution in rivers than sewage spills. One part of that is livestock and, at the Rivers Trust’s April Zoom conference, one attendee wondered if it might be possible to assemble a similar map that includes relevant data. This is tricky at the moment, said Walker. There is nothing in the way of a national dataset covering livestock units, although some consultancies and other groups are attempting to model the impact of agriculture across different catchments.
And of course, livestock units comprise very mobile elements – cows and sheep, which are hard to track in real-time, but there are other possibilities for proxy measurements that could provide useful information. One odd detail mentioned was that, in fact, sheep faces are more impactful on human health than that of other animals, so data about animals and their proximity to a river definitely would be useful, to swimmers and so on.
It might just be a matter of “getting low-cost sensors out there”, she said. Maybe not bacterial monitoring, as that’s difficult to do in real-time, but something that might alert you to the fact that “something’s changed in the river today” and so on.
Comparing with weather data
One type of investigation that has already been important in making sense of what’s happening with sewer outflows is correlating spillage data and weather data, a line of enquiry that has been pursued by computer science expert and river campaigner Peter Hammond. The EAC’s January report on Water Quality in Rivers also recommended that the EA institute this kind of monitoring, using tools such as machine learning and AI.
Walker said the Sewage Map can be useful at looking at this kind of thing. Is this storm overflow really due to excess rainfall? Or is it happening when it shouldn’t be? You can learn more with the map, but there’s a more detailed tier of information still needed. You would have to submit an FoI request to your water company to get the start and stop times for particular spills, and then collate the rainfall information separately with this. Peter Hammond is running a webinar on this topic in the near future, “which will be brilliant for people who want to dive into that detail”.
Live data feeds?
Getting the national data collated in its current form seems to have been a significant milestone in itself, and the fruit of extensive collaboration between the EA, water firms, eNGOs and others. More and better data seems to be in the pipeline. The Environment Act specifies the provision of “near-real-time information” on overflows, and this could be available as live feeds to resources like the Sewage Map, one of a number of developments The Rivers Trust says it is pushing to achieve via things like Defra’s Storm Overflows Task Force.